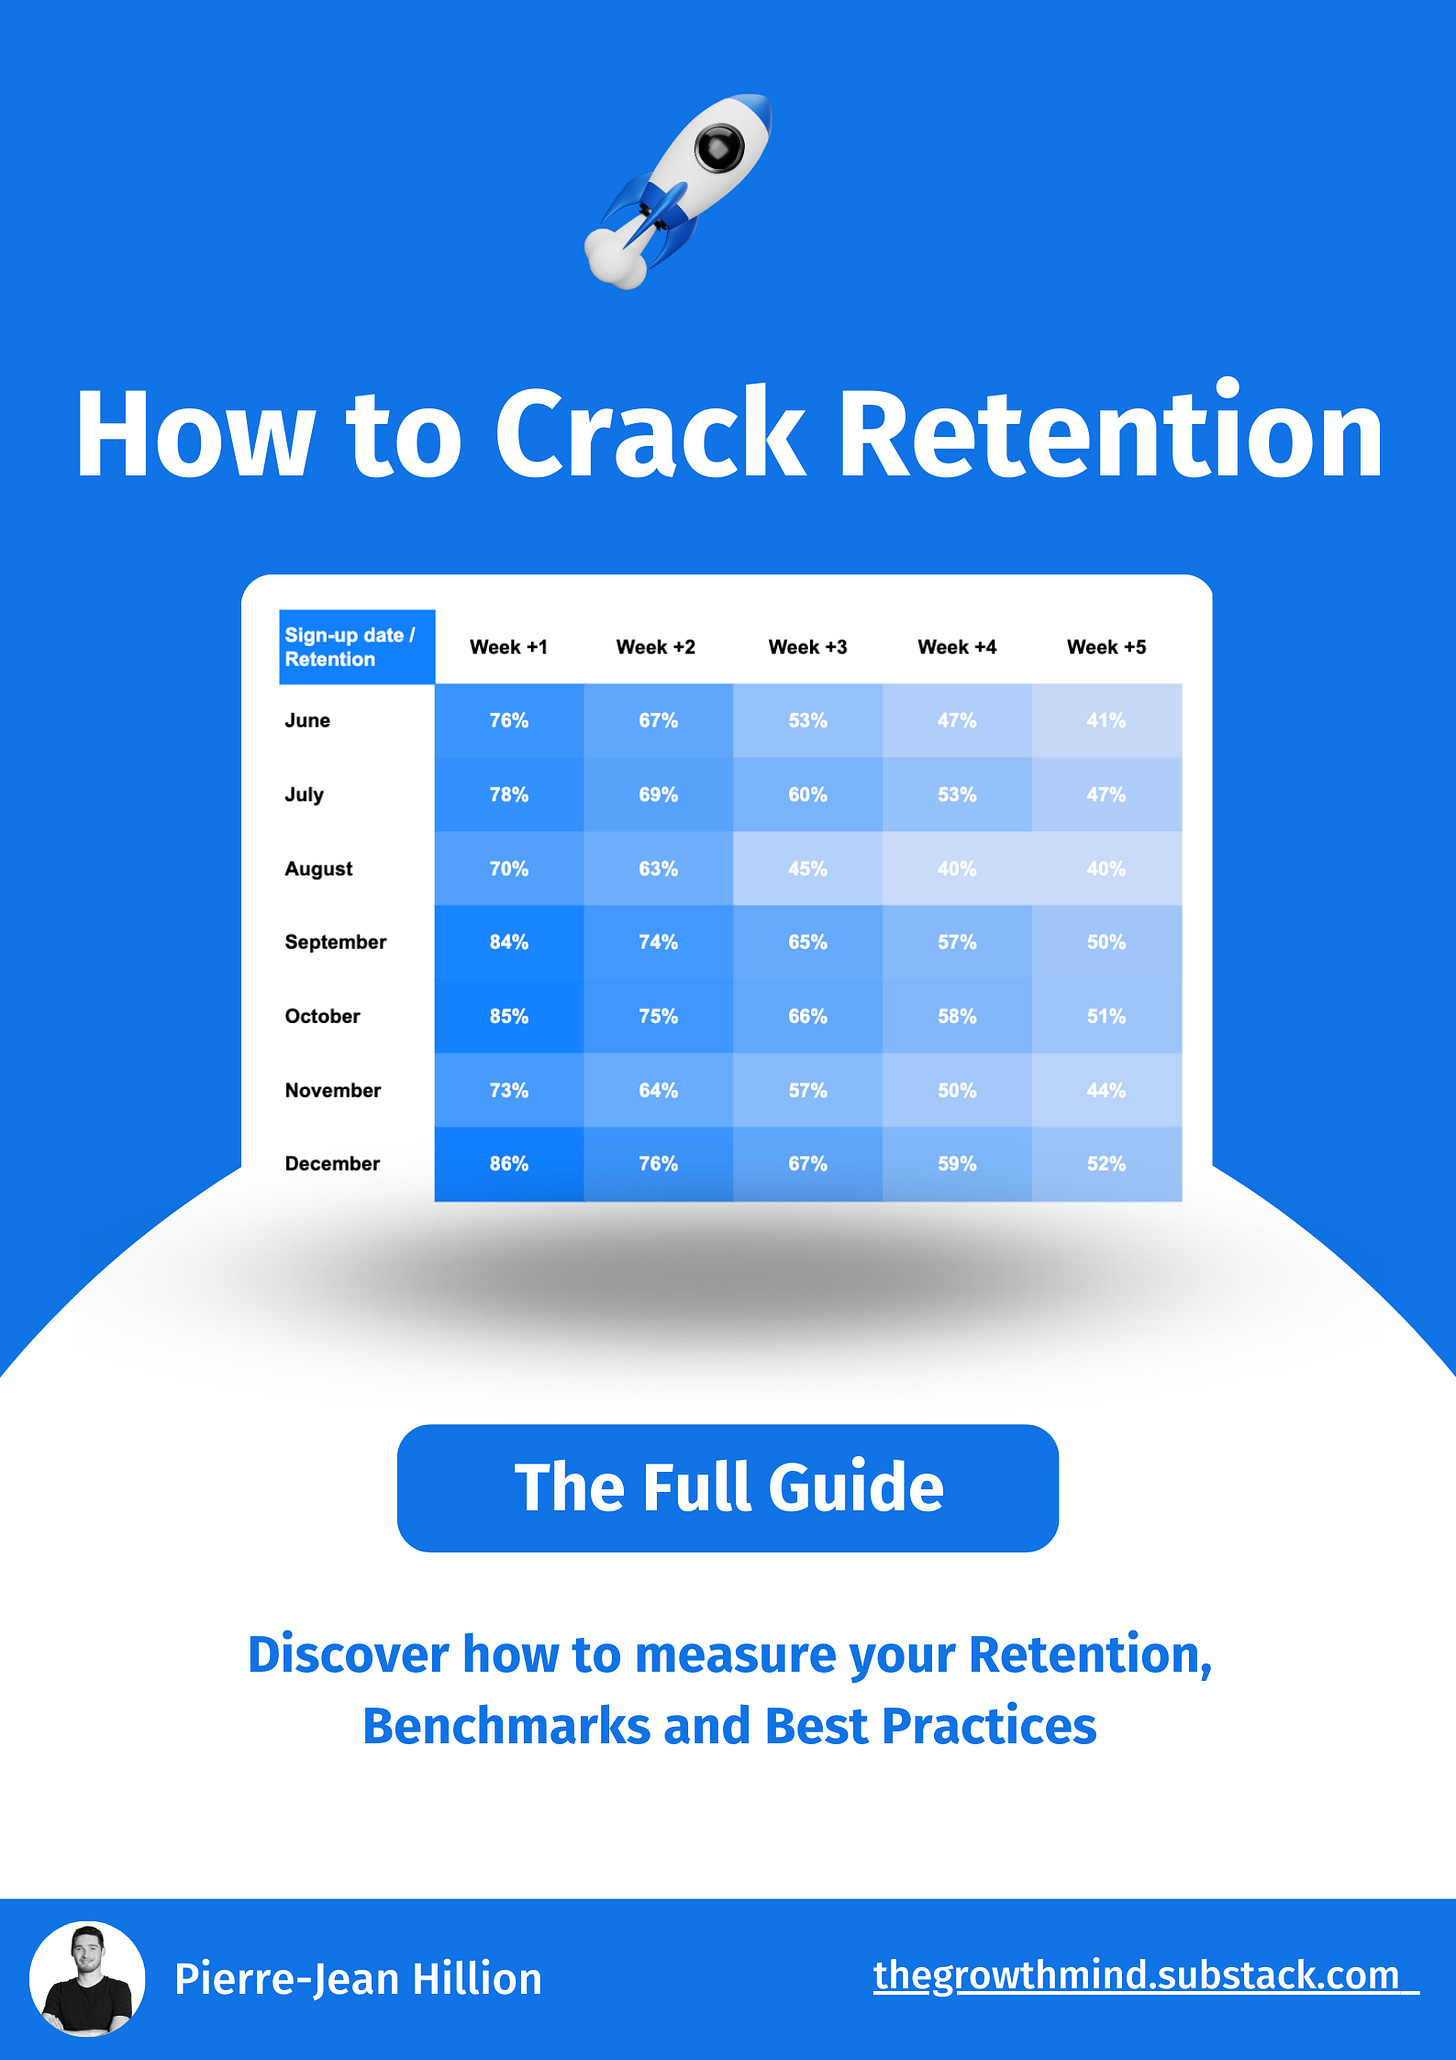
How to Crack Retention - The Full Guide
Discover Retention Benchmarks, Best Practices and the importance of Retention for sustainable growth
Hi Growth folks 👋 It’s Pierre-Jean there!
I’m a Growth Manager at BlaBlaCar and share every 2 weeks Growth articles, inspired by the world’s leading scale-ups.
We’re now 5,114 on the newsletter (great milestone to cross 5k!), so thanks for your support 🫶
In today’s +4,500 words full guide about Retention, we discuss:
🏆 Why retention is a crucial metric to win
🎯 How to define and measure your retention metric
📊 Retention benchmark: what is a bad/good/great retention?
🚀 10 best practices to increase retention
It’s the most in-depth guide I wrote since I started the Growth Mind 1.5 years ago, so I hope you’ll enjoy it. Let’s go!
1# Why retention is the crucial metric to win 🏆
Retention is a metric often underrated in the startup world. Everyone tends to be focused on generating new leads and cracking the acquisition part of the funnel.
But retention is probably the most important metric to crack for a business. It’s the metric that measures the percentage of users who continue using/pay for your product over time.
And when your customers stick with your product, a lot of problems related to acquisition disappear.
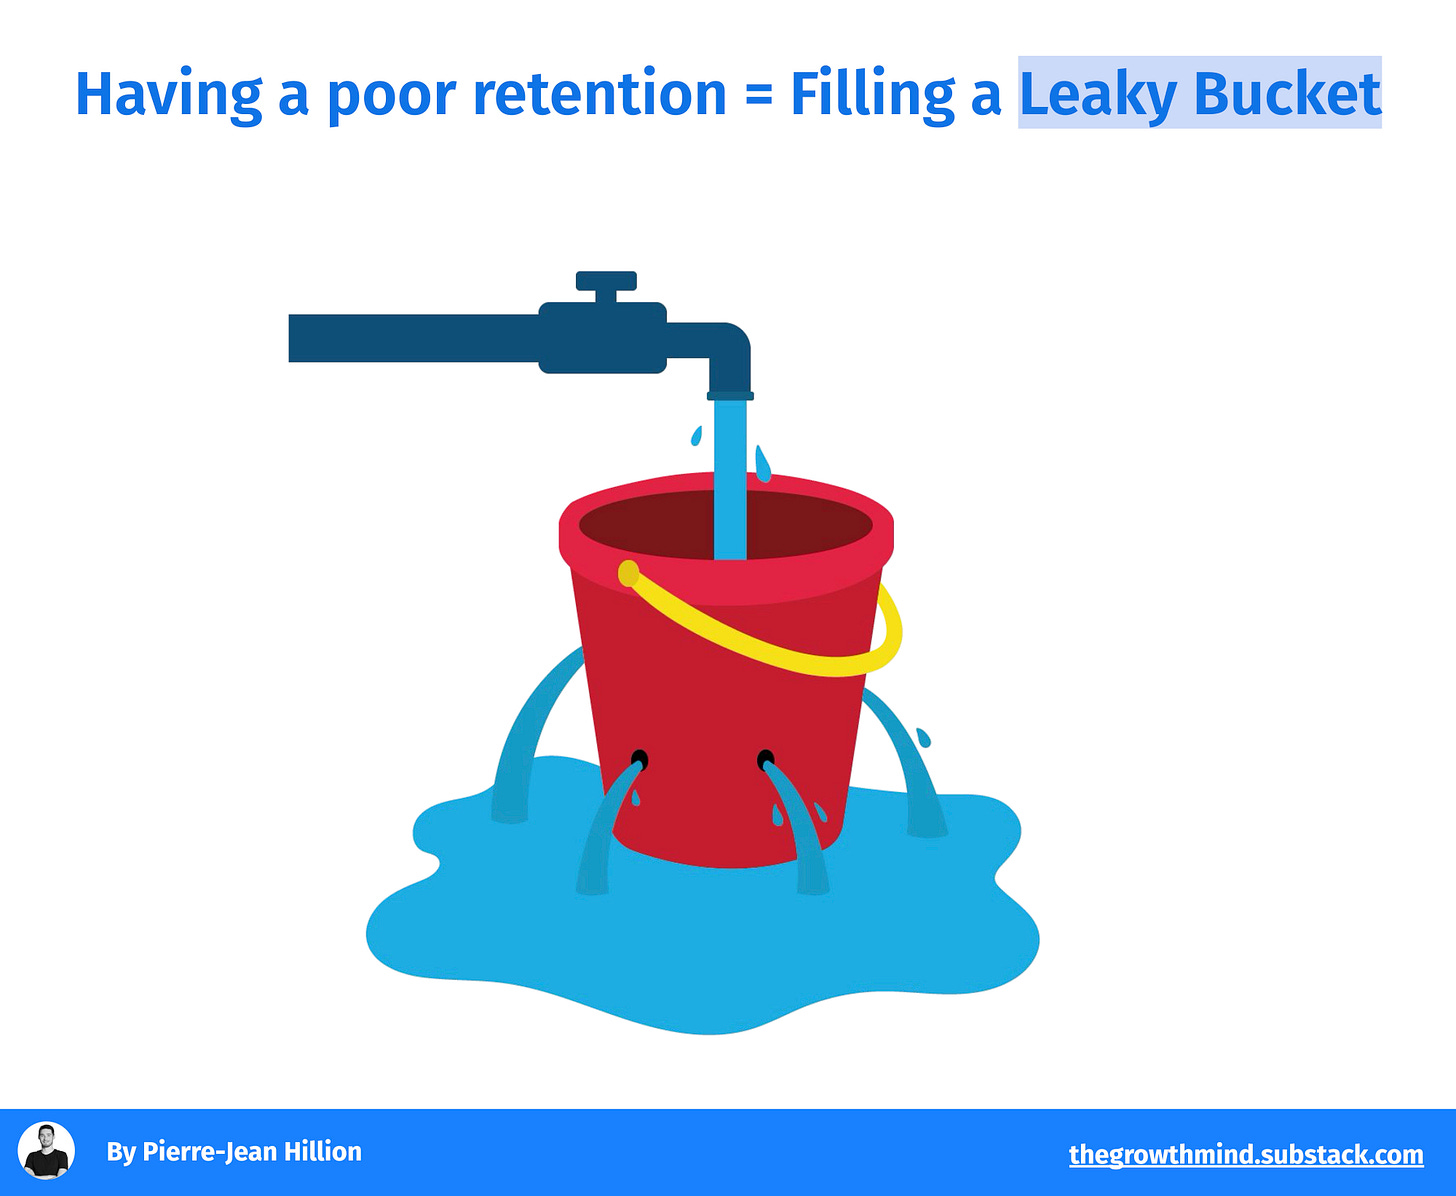
Because you can be as good as you want on acquisition, if people don’t use your product over time, you’re filling a leaky bucket and paying to acquire users that will generate zero to a little revenue over time.
All the best companies that win have cracked (at least partially) the retention problem and can make their users stick with their product, making them able to drastically increase their LTV (lifetime value) and reduce their CAC (customer acquisition cost).
3 key figures to highlight the importance of retention ⬇️
Mobile apps lose on average 77% of their users within the first 3 days after sign-up. But the best apps outstand the crowd and have an average retention of up to 3.5X higher for the top 10 apps. The difference is astonishing and proves the best apps have cracked retention.

Keeping a customer costs on average 5 times less than acquiring a new one. Good retention leads to a drastic reduction in acquisition costs and a much higher LTV (lifetime value). If you crack retention, acquisition is becoming a less important problem.
A 5% increase in customer retention can lead to an increase of 25% to 95% in a company's revenue (Source: Bain & Company). A small retention improvement can lead to a huge revenue increase.
To illustrate the impact of great retention, let’s look at the concrete example of 2 companies:
Company A acquires 60k new users per month and has a 88% monthly retention rate.
Company B acquires 80k new users per month and has a 78% monthly retention rate.
This example is astonishing: a company (company A) that is acquiring way fewer users (60k vs 80k for company B) on a monthly basis, but with a great monthly retention (88%vs 78%), is the one that will win over time when looking at active users.
Then, you probably ask yourself: why do companies under-optimize retention?
It takes time and it’s hard to measure improvements in retention: As it’s by definition a long-term metric, actions to improve retention can take months or even years to prove their effects. Of course, you can use good proxies (like short-term retention of usage frequency) to estimate the impact of an action, but it’s way more difficult to see the impact than if you were testing a new landing page for example.
The impact of retention on revenue is not properly modelized: Many companies don’t properly estimate the impact of retention on their bottom line. If I ask you “How much revenue do you generate with a new customer?”, you’ll very likely have the answer. But if I ask you “How much revenue do you generate by improving your retention by 5 percentage points?”, I bet giving a precise answer would be more difficult. It’s something a bit harder to estimate, so we tend to not do it. But the example above shows that a few percentage points can drastically change a business trajectory.
→ Retention is a silent killer.
You don’t focus on optimizing it, and at the beginning, nothing happens. New customers continue to arrive and everything looks going well. But after a few months, you realize that you’re unable to pay back the money used to acquire those customers and that they don’t stick with your product. As improving retention takes time, moving the needle in the right direction will take months. The situation, especially for fundraised startups running out of cash, can become catastrophic.
But retention is becoming a more and more important metric recently.
Especially within the current context, where being fundraised is much harder than a few years back, and achieving profitability is not an option.
Growth teams started to slowly shift their focus on retention, as explained in the latest “State of Growth” report from growthhackers.com.
Experimentation Focus of Growth Teams - 2023 vs 2022
→ The share of experimentations aiming at improving Retention nearly 2X between 2022 and 2023. But acquisition is still the main focus by far. Evangelizing retention and its importance is key.
Retention is the foundation of sustainable growth. And improving it also directly impacts other metrics:
Improving retention increases Acquisition through word of mouth: The more people use your product, the more they’ll be likely to recommend it. Simply because they love it, and using it over a long period will give them more chances to talk about it. Retention is then a wonderful driver to increase virality through word of mouth, or with a referral program.
Improving retention increases monetization opportunities: The more people use your product, the more they’ll want to pay for it. That’s especially the case for freemium or free trial products, which need to convert free users into paying customers.
With over 4,500 words and +20 images, this post is too long for e-mail:
2# How to define and measure your retention metric 🎯
A. Define your Retention Metric
Retention can be measured:
On revenue (Revenue retention): Customers retained continue to pay for your product.
On product usage (User Retention): Users retained continue using your product.
Both are extremely valuable. But User retention is what powers Revenue retention for products. So you aim first, when working on a product, at improving user retention.
If you’re working on a service business (eg. an agency), focusing on revenue retention makes more sense, as you don’t have people using regularly a product with free features for example.
Let’s focus then on how to define your User Retention metric. Every product is different, so your retention metric should be tailored to it.
To define properly a custom Retention metric for your product, I advise you to follow the three following steps 👇
Step 1: Determine the event reflecting your core product usage
The goal of this exercise is to understand what “Active” means for you. We always calculate retention on active users, but this notion of active is different for everyone.
While many companies measure retention on basic events like an app visit or a website connection, I don’t recommend doing it. It’s a too-top-of-the-funnel event that does not properly reflect your capacity to make users enjoy your product.
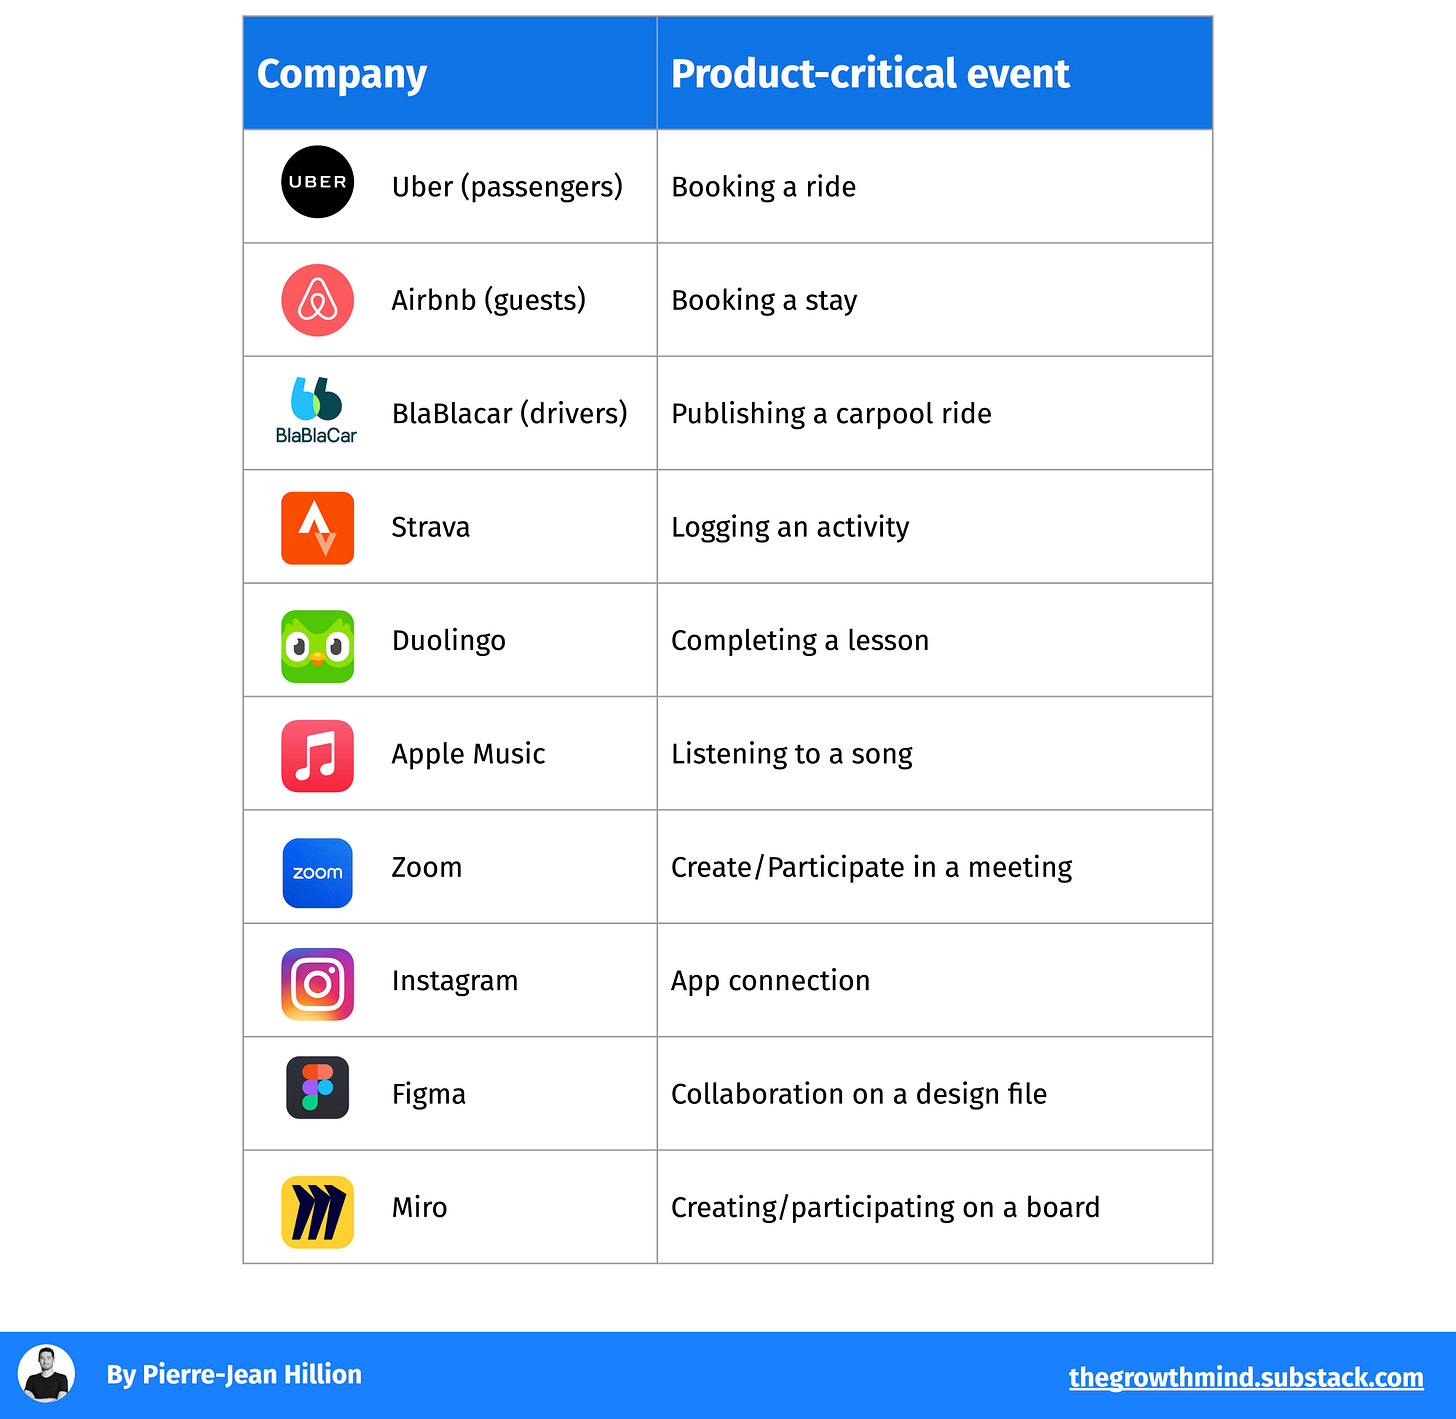
Instead, you should base your retention metric on an event reflecting your core product usage. It will tell you how frequently your users/ customers are doing the one action you want them to do, which is your main Product Critical Event. This event should be based on the main use case your product is solving.
Let’s look at a few examples of product-critical events, to illustrate this:
The common trait between all those examples? You have a single specific event, linked to the usage of the main value of the product, used to measure engagement and retention. By measuring retention based on this event, you make sure to optimize on providing value when working on improving retention, and not optimizing for low intent events like app visits.
→ Once you have defined your Product Critical Event, you can clearly understand what “Active” means for you.
NB: for some SaaS products having multiple core features, sometimes tailored to specific use cases, retention might be measured on a group of events rather than a specific single event. Because some users might use one feature but not the other, but they are still retained. Even if I don’t particularly like this approach normally, that could make sense in those cases.
Step 2: Determine the natural usage frequency
Once you have determined the event reflecting your core product usage, it’s time to understand what’s the natural frequency of usage of your product.
Determining this natural frequency will affect the time window on which you measure retention.
Some products have a daily natural frequency, while other might have a monthly or even annual usage. It’s necessary to properly determine this frequency to optimize for the right timeframe.
Measuring a weekly retention for an airline does not make sense. Your retention will by design be extremely low, if not zero.
Once we’ve said that, how do you determine the natural usage frequency of your product? Here are 3 techniques you can use:
User Interviews and Surveys: Asking your users how often they use your product, and/or how often they encounter the problem you’re solving, is a great way to get qualitative data on your product's natural usage frequency.
Cohorts Analysis: Deep dive into your cohorts and analyze what is the average frequency of usage of your active users. In most cases, you’ll probably see that a big segment is using your product at the same interval. You’ll also notice that some segments of users, generally smaller ones, have a significantly higher or lower frequency of usage. Those segments are either power users (in case of an abnormally high frequency) or not qualified users (in case of low frequency).
Industry Benchmarks: Looking at what is the natural frequency of your direct competitors or even substitution products is also a good way to get learnings. You’ll generally quickly find some patterns. However, I recommend first focusing on the two techniques presented before, as they are based on your users.
Now that you know your product's critical event and the natural frequency of usage of your product, you can use the following formula to determine your Retention Metric:
Retention Metric = Natural Frequency + Product Critical Event (main use case)
If we come back to some of our examples before, it would give for:
Uber passengers: Weekly active rider
Duolingo: Daily active learner
Strava: Weekly active athlete
The Retention Metric should be widely shared throughout your team and company, so everyone knows what you’re optimizing for.
Step 3: Tailor your retention metric to different user’ segments
In many cases, you’ll see that different segments of users have a different frequency of usage. While having a single retention metric based on the most common natural frequency of your product is key to having a simple metric to monitor, you can also go deeper and tailor your retention metric to different segments.
For example, at BlaBlaCar, some drivers publish way more regularly than others. Simply because their use case is different, for example, they might go back to their parents’ house every week. But most drivers travel less with us. So we tend to look at retention with different timeframes depending on the segment, even if we have a global retention metric used as a north star.
B. Measure your Retention Rate
Now that you have determined your Retention Metric, it’s time to start measuring it!
Retention measures the percentage of users/customers who continue to use/pay for your product over time. It’s calculated as a rate.
Retention rate = [users retained at the end of the period/ users at the beginning of the period] x 100
The “period” of analysis here corresponds to the natural frequency usage of your product, determined before.
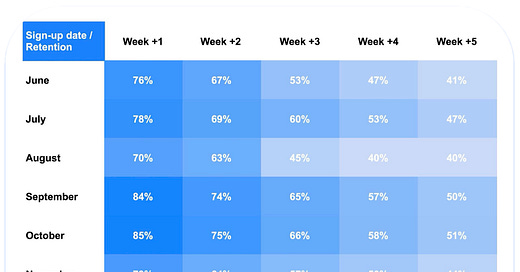
To visualize your retention evolution over time and see how it evolves per cohorts of users, you either use table or chart views.
A chart view gives a great overview of cohorts’ retention over time. That’s the best view to quickly see big trends and see if everything is going well or not.
A table view is harder to read but has the advantage of showing the exact rates at a given period. It’s especially useful when you want to detect small variations.
→ To measure the impact of your efforts on retention, looking at the cohorts who signed up after you rolled out an action is a great way to do it.
Aside from comparing retention based on sign-up date, you can also do it by looking at user characteristics, country, or whatever other split you find relevant for your activity.
Product analytics tools like Mixpanel, Amplitude or June are great for measuring retention based on custom events, segments of users, and many more. I definitely recommend using one of these tools as early as possible.
Apart from your Retention Rate, there are other metrics you can monitor that are directly linked to Retention:
Frequency: How often do people use your product? A great frequency generally positively impacts retention, because it’s a sign of regular engagement.
Lifetime Value (LTV): LTV is a metric estimating the total revenue a business can expect from a single customer within its lifetime. It reflects the financial value of each customer, taking into account their revenue contribution and their retention.
3# Retention benchmark: what is a good retention? 📊
When evaluating if you’re having a good retention or not, you should look at two things:
Your retention compared to the industry: it will tell you if you’re doing better or not than the industry average, which should be your goal.
The shape of your retention curve: It will tell you if you can keep users over time and if you succeed in reactivating churned users.
Retention Rate benchmarks: What’s a good retention rate?
I’ve spent time researching different retention benchmarks and finding a single source of truth is hard. Retention rates between benchmarks can vary a lot, so I would advise always cross-checking sources, especially focusing on your industry, to compare your retention rate.
I found two benchmarks that I found especially interesting.
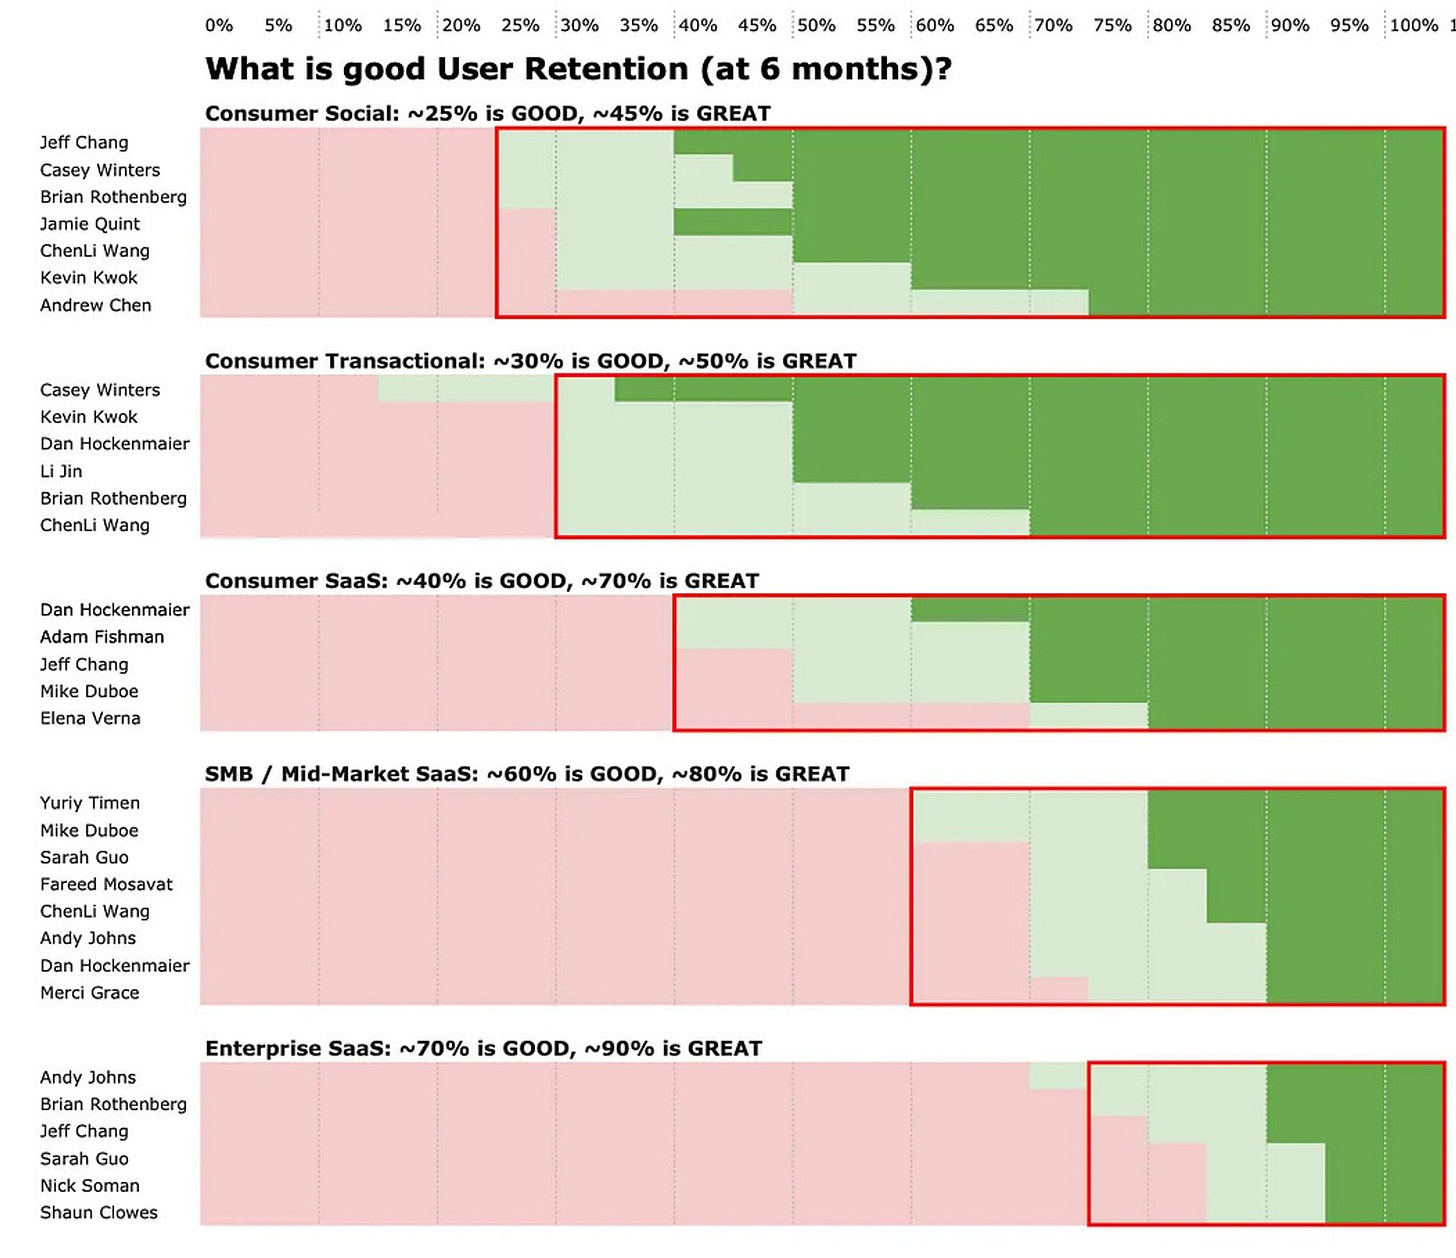
The first User Retention benchmark comes from Lenny’s newsletter, where he interviewed 20+ Growth Experts asking them what is a Good and Great retention at 6 months:
Even if not all experts agree on precise rates, we see interesting patterns.
Key takeaways on average retention rates:
Consumer products have lower retention (∼25% to 40% is good, ∼45% to 70% is great depending on the product).
SMB/Mid-Market SaaS are in the middle (∼60% is good, ∼80% is great).
Enterprise SaaS have the highest retention (∼70% is good, ∼90% is great).
Retention rates vary a lot depending on the industry, the customer target, and the product you provide. But this benchmark gives directional inputs to see where you currently stand.
The second benchmark is the “SaaS product metrics benchmark” from June.so:
They collected the data from 357 of their users in November 2023.
You can benchmark retention by filtering between B2B and B2C, but also by the stage of your business (Pre-seed, See, Series A).
Other metrics like Activation or Acquisition are also available in this benchmark. This is a goldmine.
Key takeaways on average retention rates for SaaS products:
B2C SaaS have a lower retention than B2B SaaS (the median retention at 6 months of Series A B2C SaaS is 14.5%, while it is 30.5% in B2B)
Retention tends to improve when you grow in stages, outlining that companies who go to later stages have a better retention.
There are huge differences in retention between the 1st and 3rd quartiles.
While the sample size is not very big, it also helps to recognize patterns and analyze trends. You can play with the June benchmark to discover more insights.
Retention curve shape: What’s a good retention evolution over time?
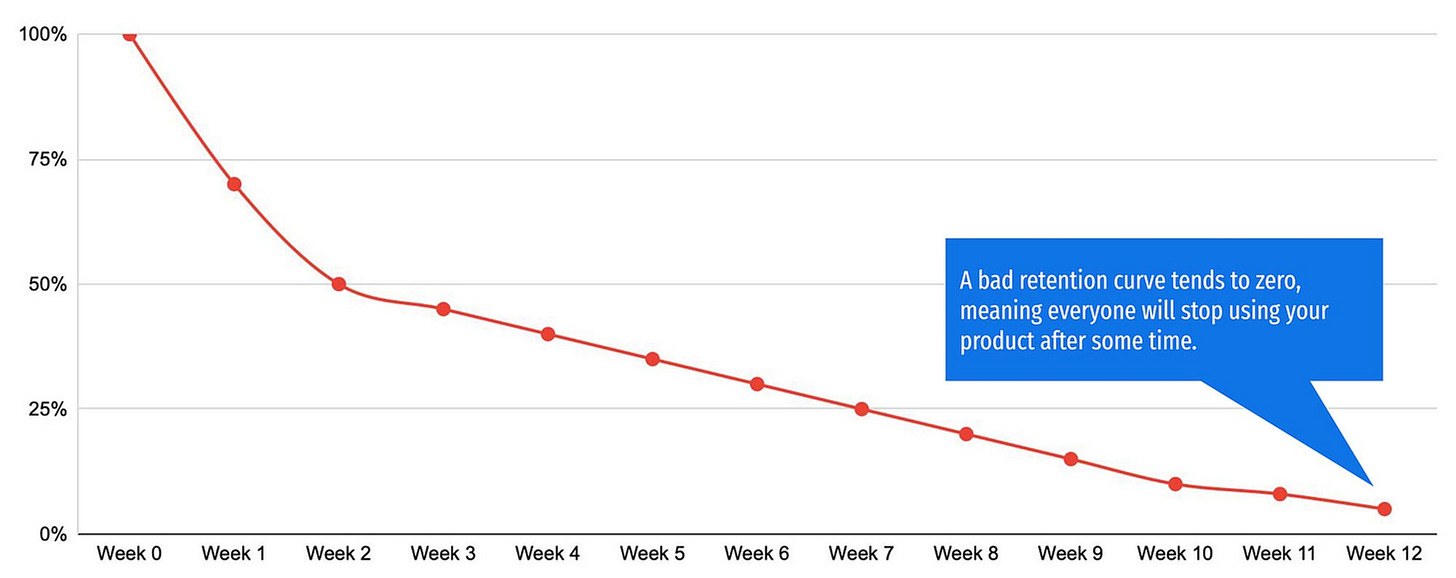
Bad retention shape → Tends to zero
A bad retention curve is a curve that is constantly decreasing.
The curve below shows us a retention that tends to zero over some time.
Why this is bad?
It indicates that users don’t stick with your product. It can be due to a lack of product/market fit or too much usage friction.
You’ll need to constantly acquire more and more users to generate traction, but even like this, you’ll probably lose revenue.
It degrades your revenue metrics (ARPU, LTV, CAC), making it impossible to have sustainable growth.
The only exception where a retention curve tending to 0 is normal is for a product or service that has been built to be used only once or very few times in a lifetime. For example, buying a home.
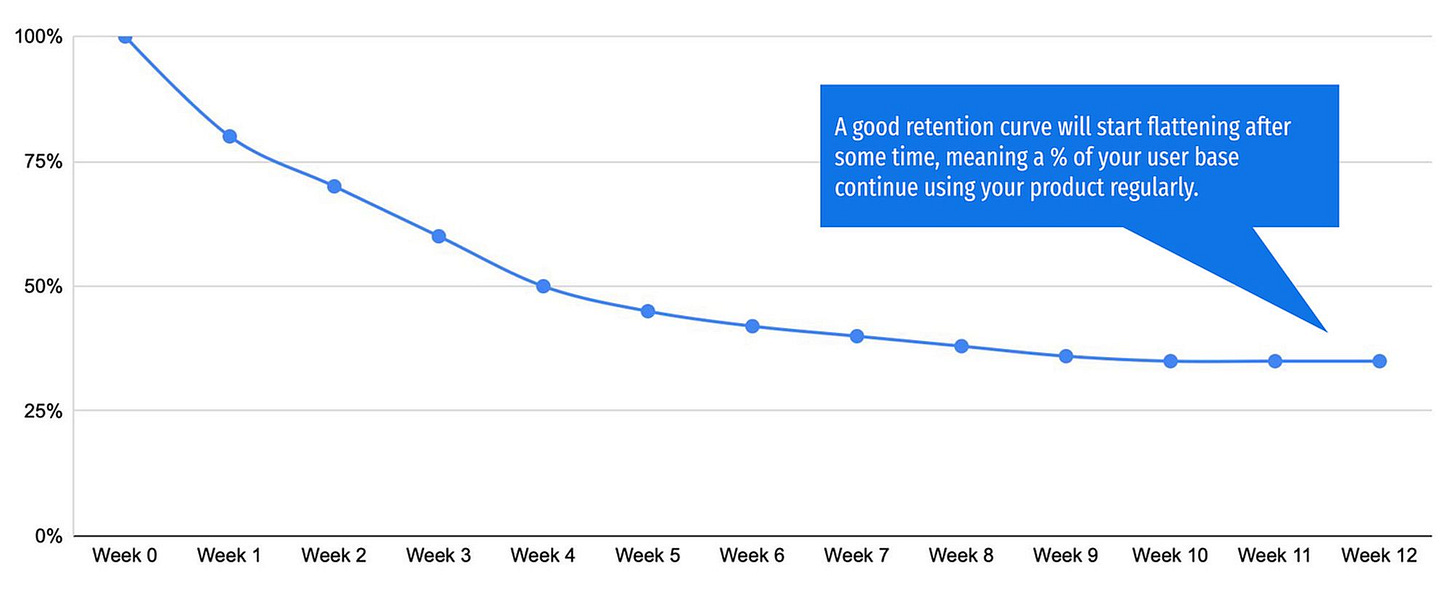
Good retention → Flatten at some point
Good retention is a retention that flattens at some point. The curve generally decreases fast at the beginning and then starts to stop dropping to reach a plateau.
The higher the plateau is, the better it is.
Why this is good?
Having a plateau means a part of your users sticks with your product.
This is a great indicator for evaluating Product/market fit.
Your revenue metrics (ARPU, LTV, CAC) can be greatly evaluated. It helps to have a controlled acquisition engine.
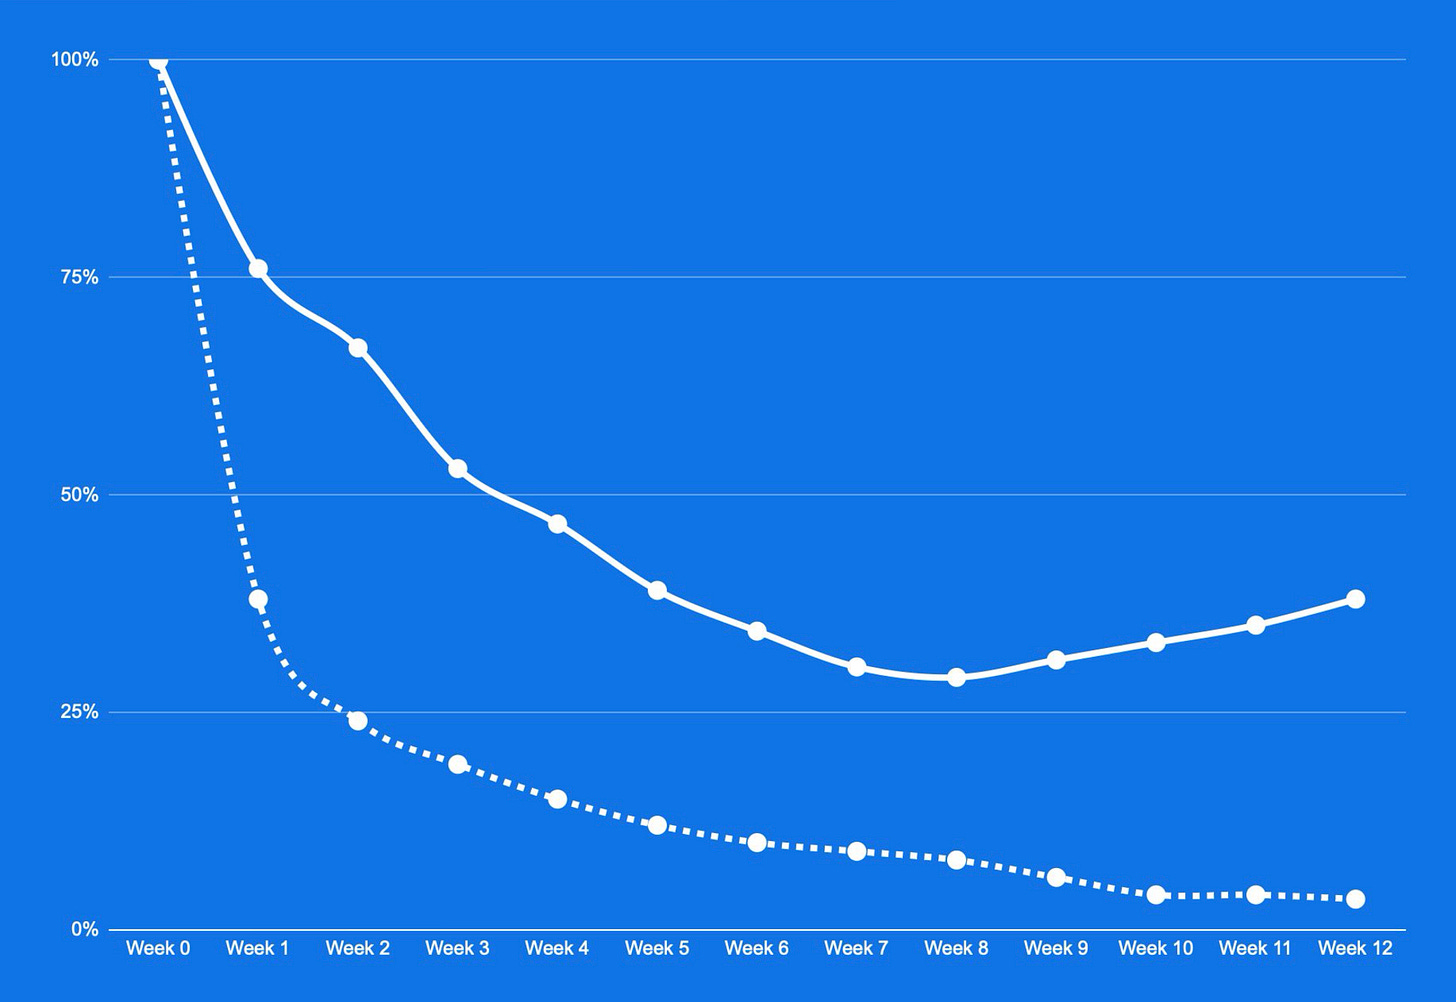
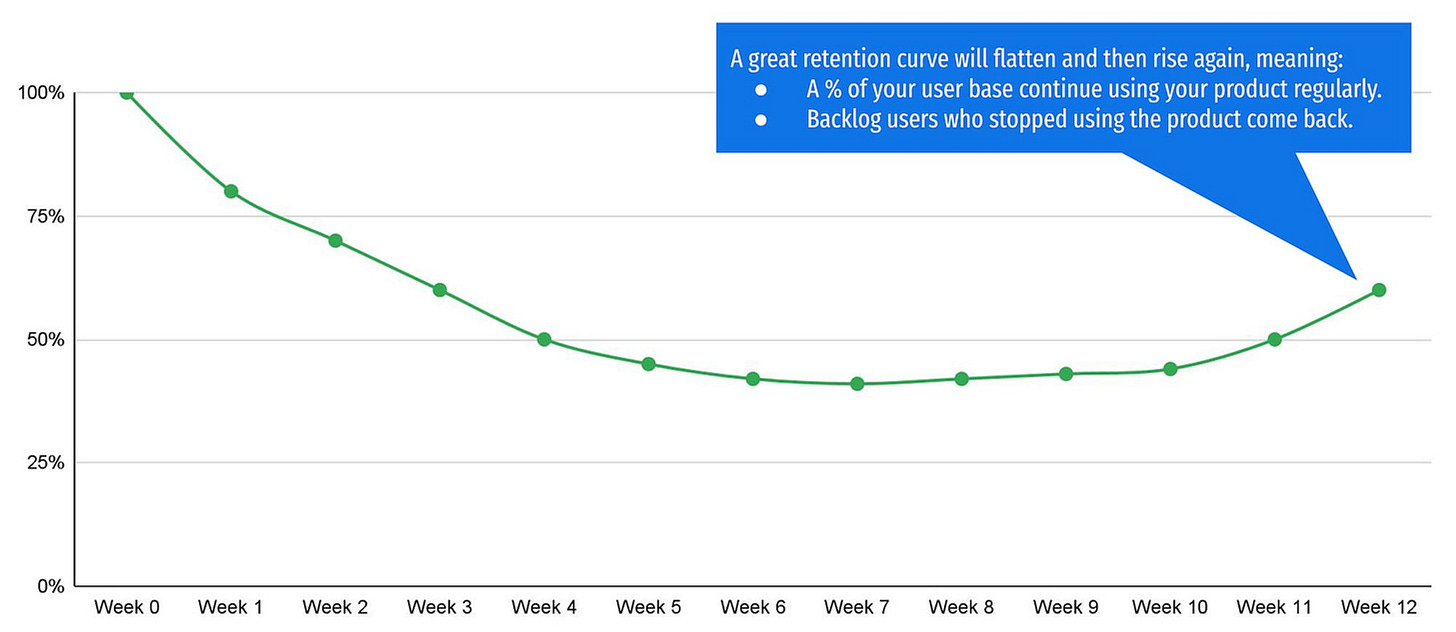
Great retention → Smiling curve: Flatten, then increases, as you reactivate old users
Why this is great?
As for the good retention curve, a percentage of your users continue to use your product regularly after some time.
Users who previously churned come back to your product (naturally or artificially). So your retention, after hitting a plateau, starts to rise again.
That’s the perfect retention situation, achieved by a very low number of companies.
4# 10 best practices to increase retention 🚀
Improving retention is a complex topic, unique to each company and situation. However, some best practices have proven to be efficient and can be used by practically every product. Let’s deep dive into 10 of them!
Introduce Lifecycle CRM programs
Segmenting your user base and sending the right communications at the right time is a powerful way to improve retention. Different channels can be used, either in-product (pop-ups, inbox messages) or outside product (emails, push notifications, SMS). With lifecycle CRM programs, you can:
Push users to have a stronger frequency
Proactively prevent churn when detecting low usage
Announce new relevant features
Having the right segmentation and triggering communications based on relevant events is key. It’s then needed to have the right tools and implement a robust tracking stack to be able to launch great CRM programs.
Launch a Loyalty Program
A loyalty program is a marketing strategy to encourage continuous product usage from customers through rewards, incentives, and exclusive benefits. It’s a good old trick, leveraged for decades by traditional businesses (Bakeries or Barbers for example).
To build good loyalty programs, it’s necessary to respect the following equation:
The right incentive: should be aligned with your core product value, rewarding customers for their usage
For the right audience: not everyone has the same experience level and depth of usage. So to have a great loyalty program, it’s key to properly define the audience you target
With the adequate level of personalization: Depending on your audience and incentive type, the objective of the program, as well as the potential incentive, will vary.
Use Gamification tactics
Gamification is the integration of game dynamics into an app's user experience to make interactions enjoyable, compelling, and addictive.
A few examples of gamification tactics:
Points, Leaderboards and rankings
Challenges, Levels and Badges
Educational tutorials
Streaks
At BlaBlaCar, where I work as a Growth Manager, we use “Experience Levels” to gamify user experience.
Our members who regularly carpool, have good ratings and a great profile are rewarded for all the work they have done.
An improved engagement and retention trigger a much larger Gamification Flywheel, having effects on the whole business:
Provide Educational Content
While a great product is often characterized by the fact it’s easy to use and intuitive, educational content can help to educate people on the best practices to get the most out of it.
Educational content can be created through several formats: Product tours, how-to guides and tutorials, webinar series, case studies showcasing successful user outcomes or interactive courses.
As an example, I like what Airbnb is doing for new hosts. They give the possibility to get guidance from a SuperHost (those with great ratings, +10 guests in 1 year and a high response rate). By doing that, they increase the chances of being successful as a new host when listing your home on Airbnb.
Monitor and understand churn reasons
According to Retently, 53% of users churn due a poor onboarding, bad relationship building, or poor customer service.
Understanding why your users churn is the starting point to improve retention.
As every company is different, the reasons leading to churn can come from many sources. You need to discover the 2 or 3 reasons that lead to churn for your company. And then tackle those reasons with dedicated actions.
To have a clear comprehension of why your users churn, talk directly with them. 10 calls with churned users will give you incredible insights into what you can improve to reduce churn. And reducing churn will drastically improve your retention.
Analyse which usage leads to better retention
As for understanding churn reasons, analyzing what differentiates your power users with higher retention from the others can give interesting insights.
Do they perform a specific action more frequently than the others?
Are they opt-in to marketing communications?
Do they have common demographical or behavioral characteristics?
Identifying patterns will help to tailor your strategies and turn more new sign-ups into power users.
Improve Activation
Retention is always strongly impacted by activation. An activated user is way more likely to continue using a product because he experienced its full value. On the other hand, a non-activated user is very unlikely to be retained over time as he did not experience the core value of your product.
So improving activation can directly link to a better retention rate.
Better target top of the funnel
Not every marketing channel and user’ segment is equal.
Some channels might bring low-quality users, who are not the right fit for your product. That’s why it’s important to assess the performance of each acquisition over the whole funnel, not only looking at the number of sign-ups.
In some cases, cutting a channel that negatively impacts your retention might make sense, even if it leads to lower top funnel volumes.
Marketing campaigns should aim at targeting the segment of users who are the best fit for your product.
Personalize User Experience
Personalization is a great way to better activate and retain your customers.
It’s particularly worth it to use personalization if you’re targeting several customer segments and/or your product solves different use cases. To personalize product usage, gather data by:
Asking a few questions during the onboarding process.
Proposing to your users to choose what use case they want to solve with your product.
With this data, you’ll be able to adapt your onboarding funnel, your product tour, and the features you will advise to use.
Figma is doing well in product personalization. During their onboarding, they ask a few questions and guide you to the use case that best corresponds to you:
Implement a continuous Feedback Loop
Finally, getting feedback from your users regularly is a goldmine to improve retention.
It helps to understand what they love, what they don’t like and what can be improved.
You can implement a feedback loop by:
Sending regular surveys to your customers
Encouraging employees to test the product and share their feedback internally (on a Slack channel for example)
Conducting ad-hoc analysis and calls with your customers
The feedback should be communicated to the entire company and easily accessible by everyone to make sure the voice of the customer is always heard.
If you have any questions or feedback to share, you can send me an email at pierre-jean.hillion@outlook or directly comment on the article on Substack.
Key takeaways of the guide:
🏆 Retention is the Crucial Metric to Win
Essential for sustainable growth and measures long-term user engagement. A bad retention = filling a leaky bucket.
High retention affects LTV and CAC positively, making acquisition efforts more efficient.
A 5% increase in customer retention can lead to an increase of 25% to 95% in a company's revenue
🎯 How to Define and Measure Your Retention Metric
Focus on Product Critical Event reflecting core usage for defining "active" users.
Determine natural usage frequency to set appropriate retention measurement periods.
Share and align on retention metrics across teams for focused improvement efforts.
📊 Retention Benchmark: What is a Bad/Good/Great Retention?
Industry-specific benchmarks provide context for evaluating your retention rate, which varies strongly depending on your product.
Understanding the shape of the retention curve offers insights into engagement and loyalty.
Aim for benchmarks that align with business objectives and growth stage.
🚀 Best Practices to Increase Retention
Enhance User Engagement: Utilize lifecycle CRM, loyalty programs, and gamification to personalize the experience, reward continuous use, and encourage active participation.
Educate and Optimize: Offer educational content to maximize product value and analyze user behavior to refine retention strategies, ensuring users recognize the product's value early on.
Incorporate User Feedback: Prioritize personalization, establish continuous feedback loops, and experiment with product features, leveraging user insights for development and retention enhancement.








Hey Pierre, thanks for sharing. Regarding the « On product usage (User Retention) metric» part, what if users are not the ones directly influencing the purchase decision? Does it still make sense to focus on user retention like this?
I feel like a lot of examples you showed are relevant for in-app purchases (duolingo, strava..)