Engagement & Retention - Growth Metrics Series (2/3)
Tracking the right metrics to build a sticky product
👋 Hi there, it’s Pierre-Jean. Welcome to this new edition of The Growth Mind!
This post is part of the “Growth Metrics” series, divided into 3 posts sent over 3 days:
Acquisition Metrics (sent yesterday)
Engagement and Retention Metrics
Monetization Metrics
⏱️ Reading time = 4 minutes
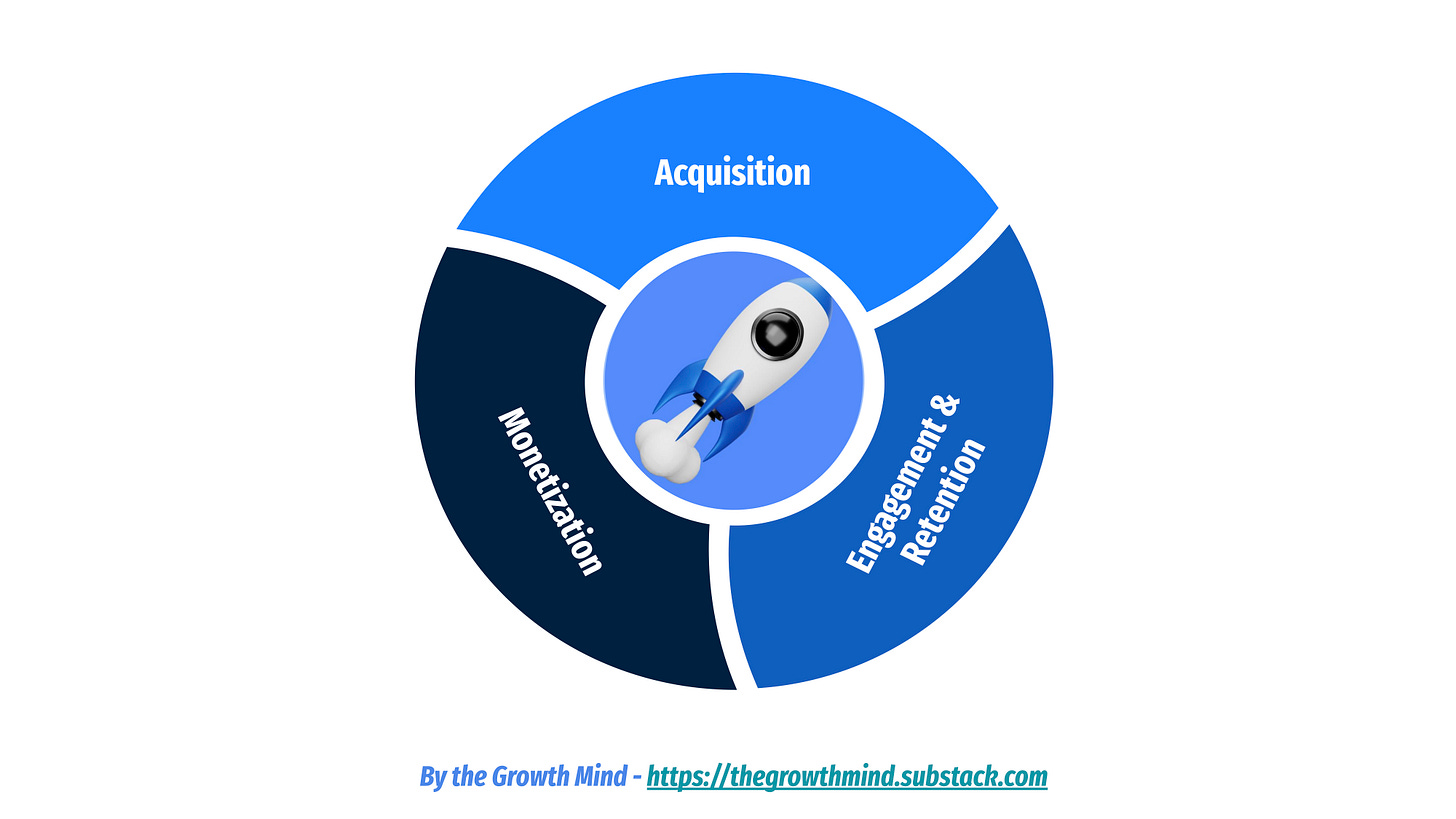
If you missed the previous post, here is a reminder of the 3 growth stages we use to monitor Growth
🎯 Acquisition: How do you make users sign-up for your product? It’s all about feeding your top of the funnel and converting visitors into leads.
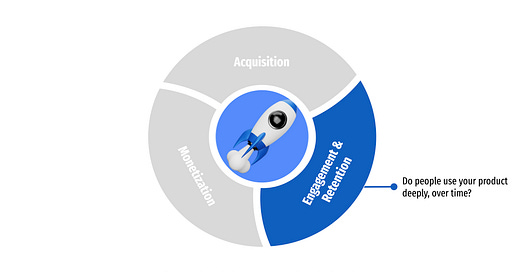
♻️ Engagement and retention: Do people use your product deeply, over time? Here we want to convert leads into active users, who are strongly engaging with our product over time.
💸 Monetization: How do you generate revenue with your users? Monetizing well leads to generating revenue. We want to look at how we perform at making revenue out of our existing users.
For each stage, it’s crucial to monitor the right metrics to see where you perform and where you can look for improvements.
Improving each metric individually can lead to a strong impact on your revenue.
Today, let’s talk about Engagement & Retention metrics 🙌
Engagement and retention is the phase where users start using your product and continue doing it over time.
This is a critical phase of the journey to optimize because it’s the phase where your users are getting value from your product.
Engaged and retained users will be users who are willing to pay for your product and talk about it.
→ Engagement & Retention power acquisition and monetization. Not the other way around.
We can split here our metrics into two groups:
Engagement metrics: how users engage with your product. It includes the activation.
Retention metrics: do users continue using your product over time.
Engagement metrics:
Activation rate: The ratio of users reaching the activation moment. Users are considered as activated when they experience the core value of your product. Each product has its own activation moment.
Time to activate (or time to value): The average time needed for your users to reach activation. Activating fast is key to not loose users during their early life. If they don’t get quickly the value product, they’re very likely going to stop using it.
User Actions: Specific actions taken by users within your product. These should be actions tailored to your product. For example, at BlaBlaCar (the company where I work, which is a carpooling platform), we look at how frequently drivers publish trips, or how frequently passengers send requests to book a trip. The purpose of monitoring user action frequency is to understand if your users are really using your product. Those actions can be multiple and should be monitored very carefully.
Feature adoption: the percentage of people using a specific feature of your product. It’s a great success indicator for the launch of new features.
Average Session Duration: The average length of a user's session. Depending on your product, it can be short or long. For example, social media or games want to improve session duration to have more engaged users, which can be better monetized with ads.
DAU/WAU/MAU: The number of Daily - Weekly - Monthly active users of your product. Having a lot of users signing up for your product is great, but keeping them active is better. Dormant users are not the ones who are going to be monetized.
Retention metrics:
Retention rate: The percentage of users/customers who continue to use/pay for your product over time. Retention is calculated as a rate and can be monitored per day, week, month, or even year depending on the frequency of use of your product/service. You can monitor retention on revenue and product usage.
Churn rate: The percentage of users who stop using your product. That’s basically the opposite of the retention rate. When analyzing your churn rate, it’s important to understand where your churn comes from: is it a natural churn (external reason making users stop using your product) or a churn due to your product?
Time to churn: The average number of days/months/years it takes for your users to churn. It should be as long as possible.
Repeat purchase rate: The percentage of current customers who come back and make another purchase. Having a solid repeat will definitely improve your financial metrics. It’s cheaper to sell to already acquired users than to new ones.
How to analyze your Engagement & Retention Metrics? 📊
For engagement and retention, it’s important to monitor metrics per user segment.
To build your segments of users, consider creating funnels and cohorts based on:
Acquisition channels: Different acquisition channels might bring more or less qualified product users. Looking at engagement and retention per acquisition channel is a must-do practice which is often not done in many companies (Marketing look at until sign-up only, Product don’t look at acquisition metrics).
Behavior: It can be the use of a specific feature, if user is activated or not, the number of user actions done.
Personas: Segmenting by personas is an easy way to find your ICP (ideal customer profile). To collect persona’s information, you can add some qualification questions during the onboarding.
Looking at funnel and cohorts per user segments will help to:
Understand who are your power users → The 20% of users doing 80% of engaged actions.
If some user segments are converting better than others.
Tailor your onboarding to some user segments → Having a personalized onboarding and product, with a tailored value proposition and use case, is a great way to improve activation and engagement.
Find correlations between engagement and retention → For example, a short time to activate can lead to stronger retention.
→ Funnel views are well suited for monitoring onboarding or user actions completions.
→ Cohort views are perfect for looking at behavior and retention over time.
To evaluate how you’re doing at retaining users, you can refer to this previous article of The Growth Mind:
That’s all for Engagement & Retention Metrics!
See you tomorrow for the last post of the Growth Metrics Series → Monetization metrics 💸
To share detailed feedback, feel free to:
Reply directly to this email
Shoot me a message on LinkedIn
I read everything 🫡


