👋 Hi there, it’s Pierre-Jean. Welcome to this new edition of The Growth Mind!
Every 2 weeks, I share Growth strategies inspired by the world’s leading scale-ups. To help you build outstanding Growth knowledge.
⏱️ Reading time = 5 minutes
Retention is a critical metric for every business to unlock sustainable growth.
When launching a startup or a product, many people often do the same mistake: focus on acquisition only, and forget to monitor retention.
But retention is the core of Growth.
Without good retention, a company will not be able to build a business generating revenue in the long run.
Monitoring retention can be hard:
It’s a long-term metric, so new businesses don’t have much data to analyze retention.
It’s difficult to understand if your retention is great, good, or bad without points of comparison.
It’s a silent killer: it takes time to see that bad retention is slowly killing your business.
In this new edition of The Growth Mind, we’re going to learn together:
1# What is great, good, and bad user retention
2# What is the average retention rate by product type
3# How to analyze your retention
So you’ll have the keys to know where you currently state.
What is retention? How to measure it?
Retention is a metric that measures the percentage of users/customers who continue to use/pay for your product over time.
Retention is calculated as a rate and can be monitored per day, week, month, or even year depending on the frequency of use of your product/service.
Retention rate = [users retained at the end of the period/ users at the beginning of the period] x 100
Retention can be measured:
On revenue (Revenue retention): Customers retained continue to pay for your product.
On product usage (User Retention): Users retained continue using your product.
Both are extremely valuable. But Product retention is what powers Revenue retention, so you should in priority focus on it.
We’ll focus on User Retention only in this article.
What is a great, good, and bad User Retention curve?
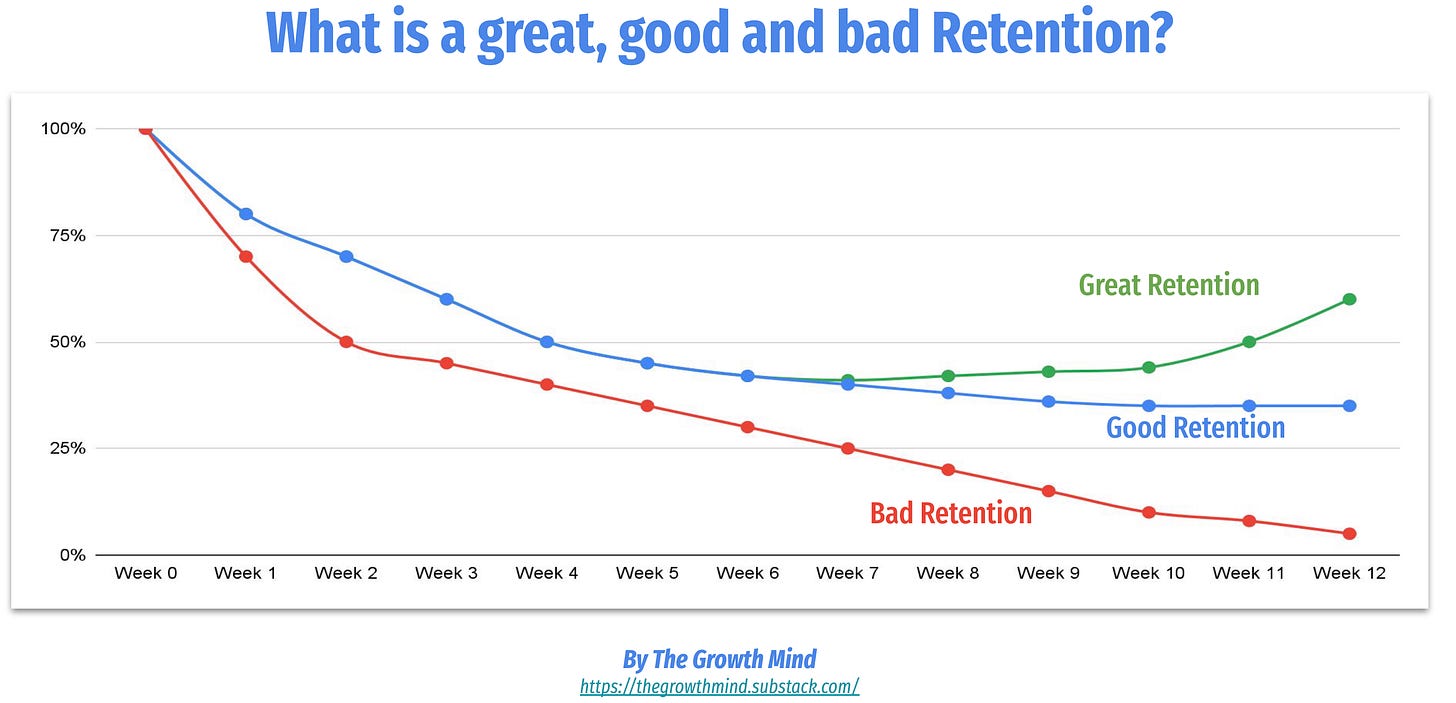
The best way to visualize your retention is to do it as a curve.
It makes you able to analyze the curve trend and shape.
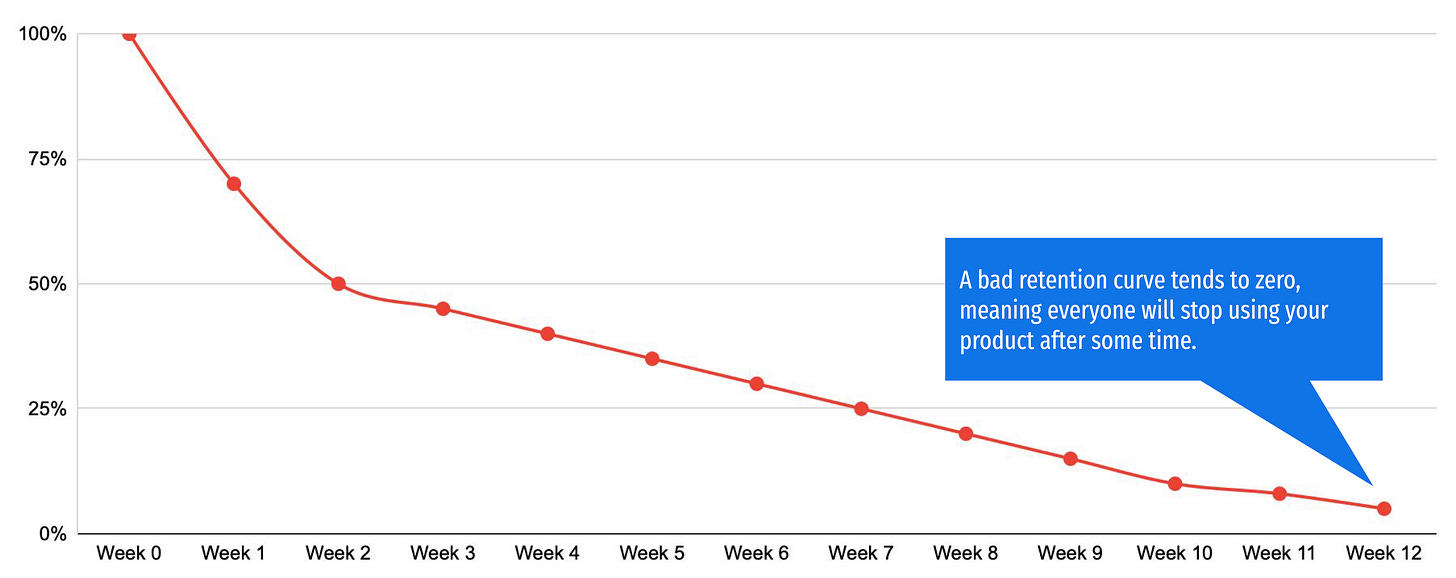
Bad retention → Tends to zero
A bad retention curve is a curve that is constantly decreasing.
The curve below shows us a retention that tends to zero over some time.
Why this is bad?
It indicates that users don’t stick with your product. It can be due to a lack of product/market fit or too much usage friction.
You’ll need to constantly acquire more and more users to generate traction, but even like this, you’ll probably lose revenue.
It degrades your revenue metrics (ARPU, LTV, CAC), making it impossible to have sustainable growth.
What can be improved?
At this point, the problem is probably your product. Focus on:
Activation moments: onboarding, aha moment.
Product/market fit.
Better targeting.
The only exception where a retention curve tending to 0 is normal is for a product or service which has been built to be used only once or very few times in a lifetime. For example, buying a home.
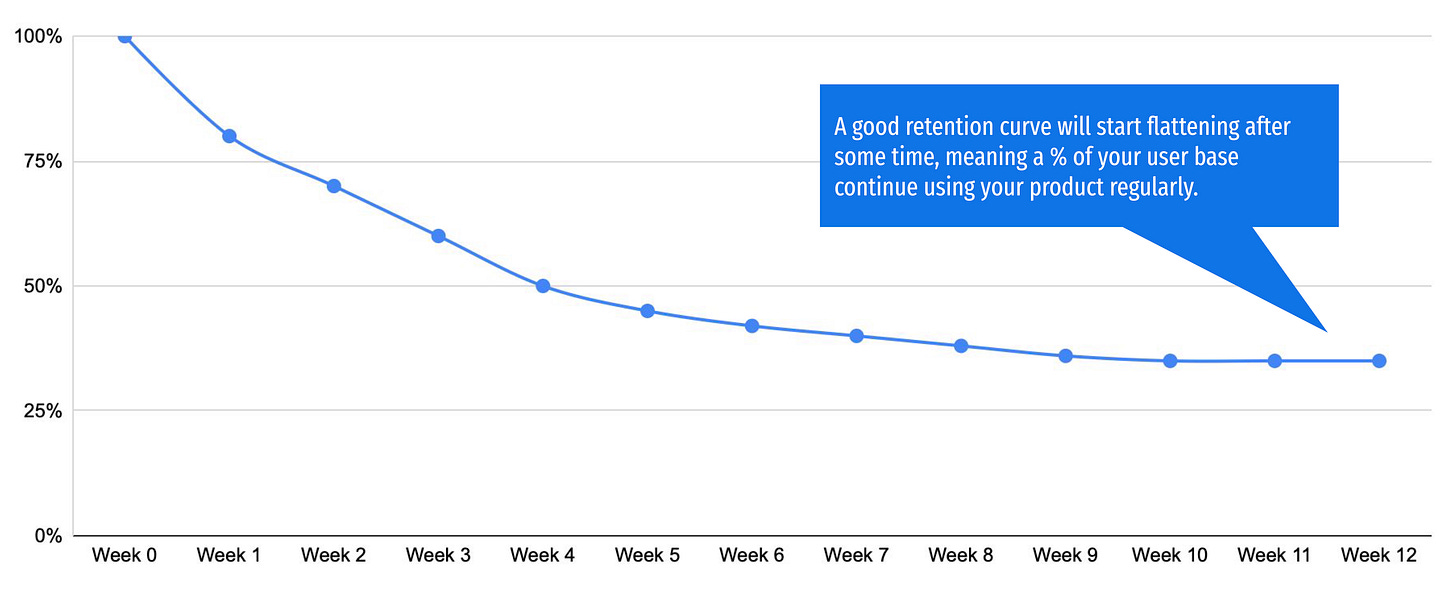
Good retention → Flatten at some point
Good retention is a retention that flattens at some point. The curve is generally decreasing fast at the beginning and then starts to stop dropping to reach a plateau.
The higher the plateau is, the better it is.
Why this is good?
Having a plateau means a part of your users sticks with your product.
This is a great indicator for evaluating Product/market fit.
Your revenue metrics (ARPU, LTV, CAC) can be greatly evaluated. It helps to have a controlled acquisition engine.
What can be improved?
When you reach a retention plateau, the goal is to raise the percentage of users reaching this plateau (eg. instead of having a plateau at 30% at Week+12, try reaching 35%). Consider doing:
Product iterations to improve activation (educational content, easier onboarding, email/push sequences).
Loyalty programs.
Gamification to increase engagement.
Reactivation of backlog users (calling campaigns, email/push communications).
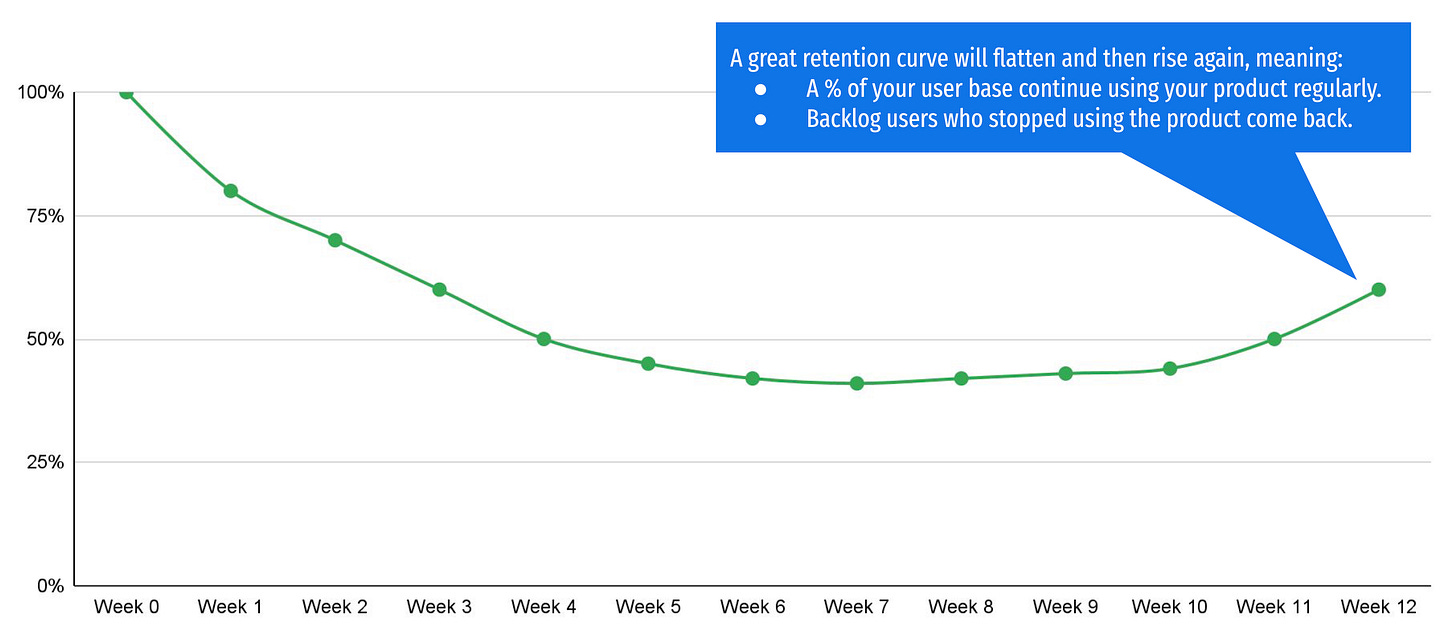
Great retention → Smiling curve: Flatten, then increases, as you reactivate old users
Why this is great?
As for the good retention curve, a percentage of your users continue to use your product regularly after some time.
Users who previously churned come back to your product (naturally or artificially). So your retention, after hitting a plateau, starts to rise again.
That’s the perfect retention situation, achieved by a very low number of companies.
What can be improved?
As you’re already in a very good situation, everything here is about optimizing what you currently do. Growth teams working on retention experiments would perfectly fit this setup.
What is a good retention rate for your product?
Now that we have the clues to analyze our retention curve, let’s look at our Retention Rate. The curve shape is one thing, but it’s also important when evaluating your retention to look at your average retention rate.
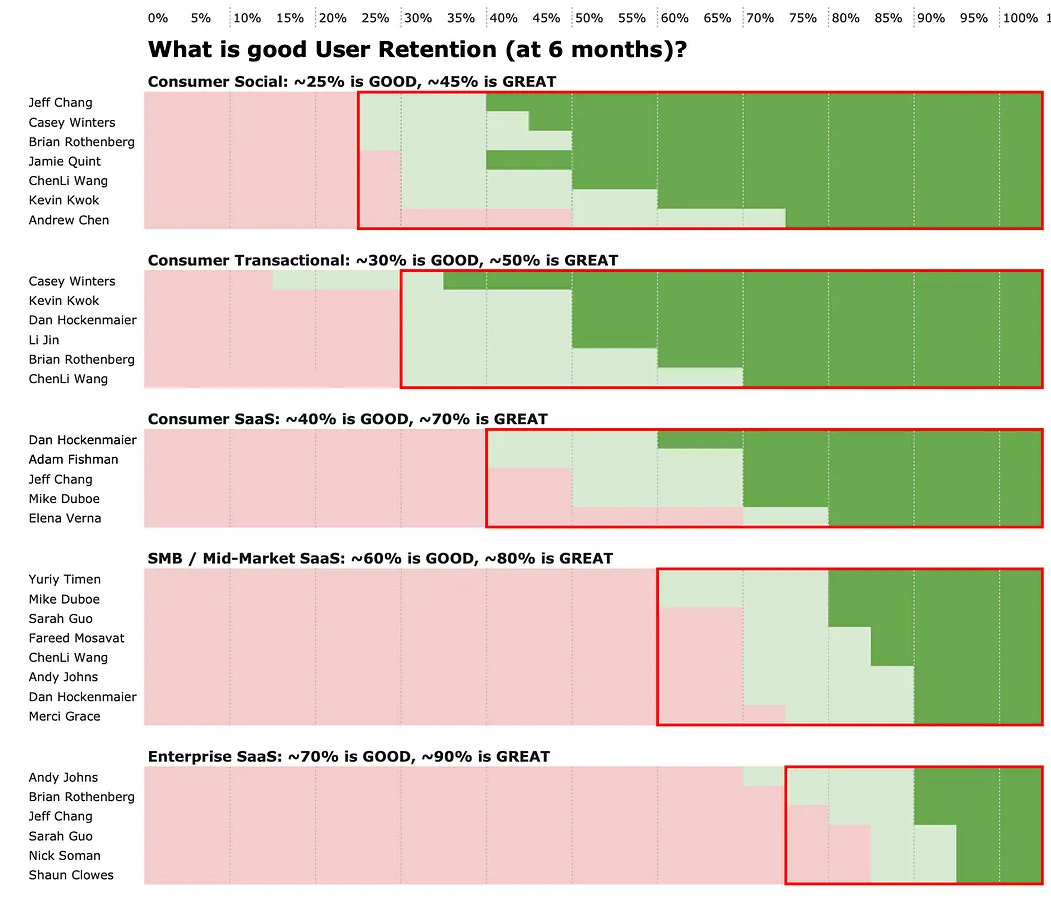
This User Retention benchmark from Growth Experts is a very insightful resource:
Even if not all experts agree on precise rates, we have very interesting patterns.
Key takeaways on average retention rates:
Consumer products have lower retention (∼25% to 40% is good, ∼45% to 70% is great depending on the product).
SMB/Mid-Market SaaS are in the middle (∼60% is good, ∼80% is great).
Enterprise SaaS have the highest retention (∼70% is good, ∼90% is great).
Keep in mind that those figures are what is considered great and good by top-tier investors and growth experts who are looking for the next unicorns. So that’s the rates you should target if your goal is to build an amazing company.
But the vast majority of the market is probably under those rates.
3 tips to analyze your retention
1# Use Product Analytics & Data Viz tools
Use Product Analytics tools like June, Amplitude, or Mixpanel to track retention.
Use data viz tools like Looker Studio or Tableau to build a dashboard with the retention curves/tables you want to carefully monitor.
2# Do a global retention analysis
Look at your global average retention and analyze:
Your curve: is it great, good, or bad?
Your average retention rate: how do you perform compared to your industry?
A simple cohort analysis, on a representative time period, will directly help you understand where you currently stand.
3# Deep-dive on cohorts
Analyze cohorts by sign-up date, jobs-to-be-done, acquisition channels, or events performed. You’ll understand if some cohorts have characteristics leading to better retention.
Do activated users have a better retention that the rest of the users? Normally yes. If that’s not the case, your activation metric is probably not well defined.
Does time to activation plays a big role in retention? If yes, improving activation timing could be key.
Do some acquisition channels have better retention than others? Some channels could bring low-quality users.
Do some user segments have better retention? It will outline that some segments have better usage of your product.
Improving retention is a really vast topic, closely linked to activation. To be retained, users need to develop a habit with your product and fully experienced its value (aha moment).
If you want to go further on improving retention, you can refer to this article 👇
That’s all for today! Congrats on reading this article, you did it!
See you in 2 weeks for the next edition of The Growth Mind. 👋


