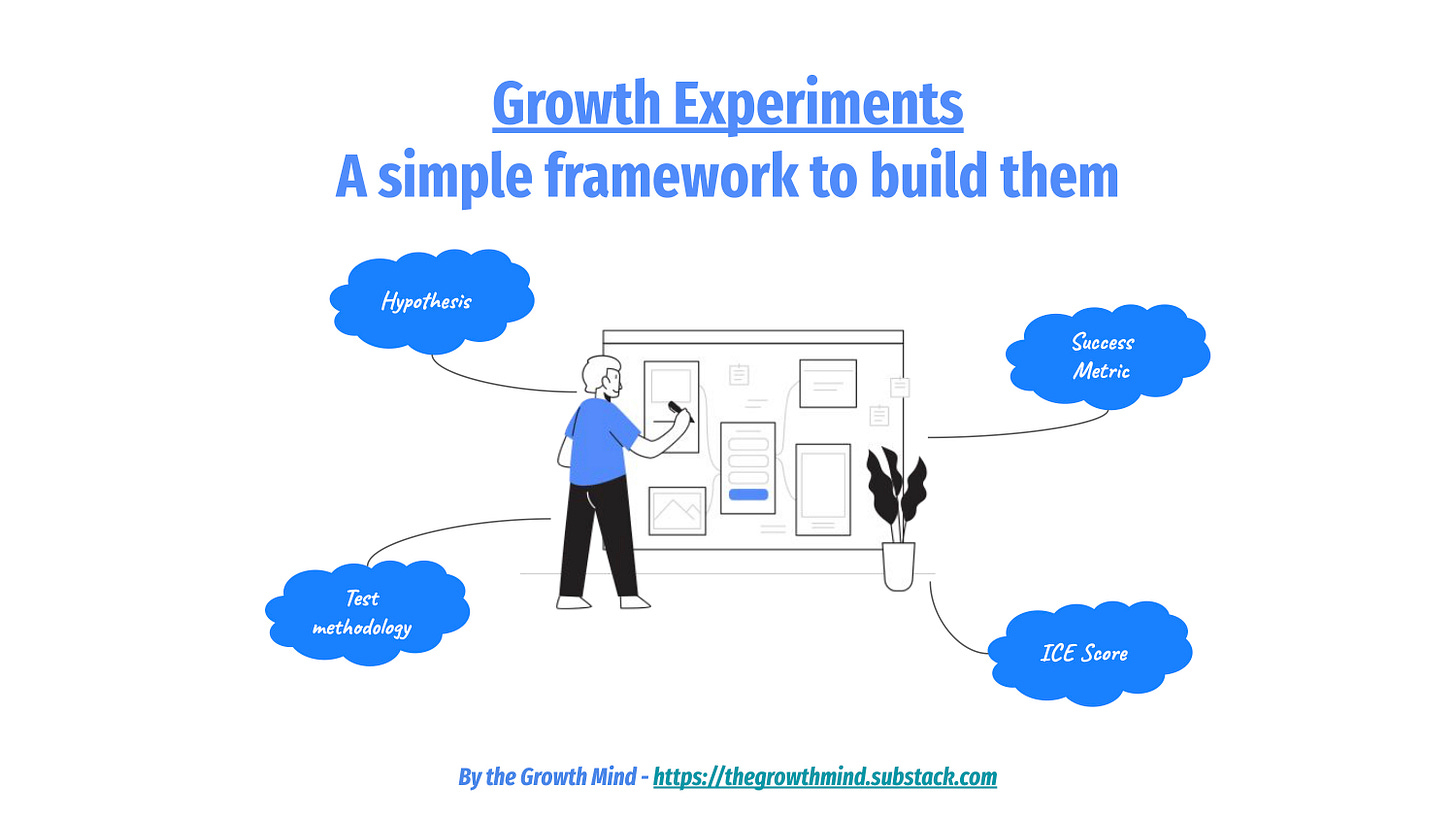
🧪 Growth Experiments: A simple framework to build them
+ My Notion template 🎁
👋 Hi there, it’s Pierre-Jean. Welcome to this new edition of The Growth Mind!
Every 2 weeks, I share Growth strategies inspired by the world’s leading scale-ups.
In today’s article, we’ll go through:
📝 A simple framework to build growth experiments
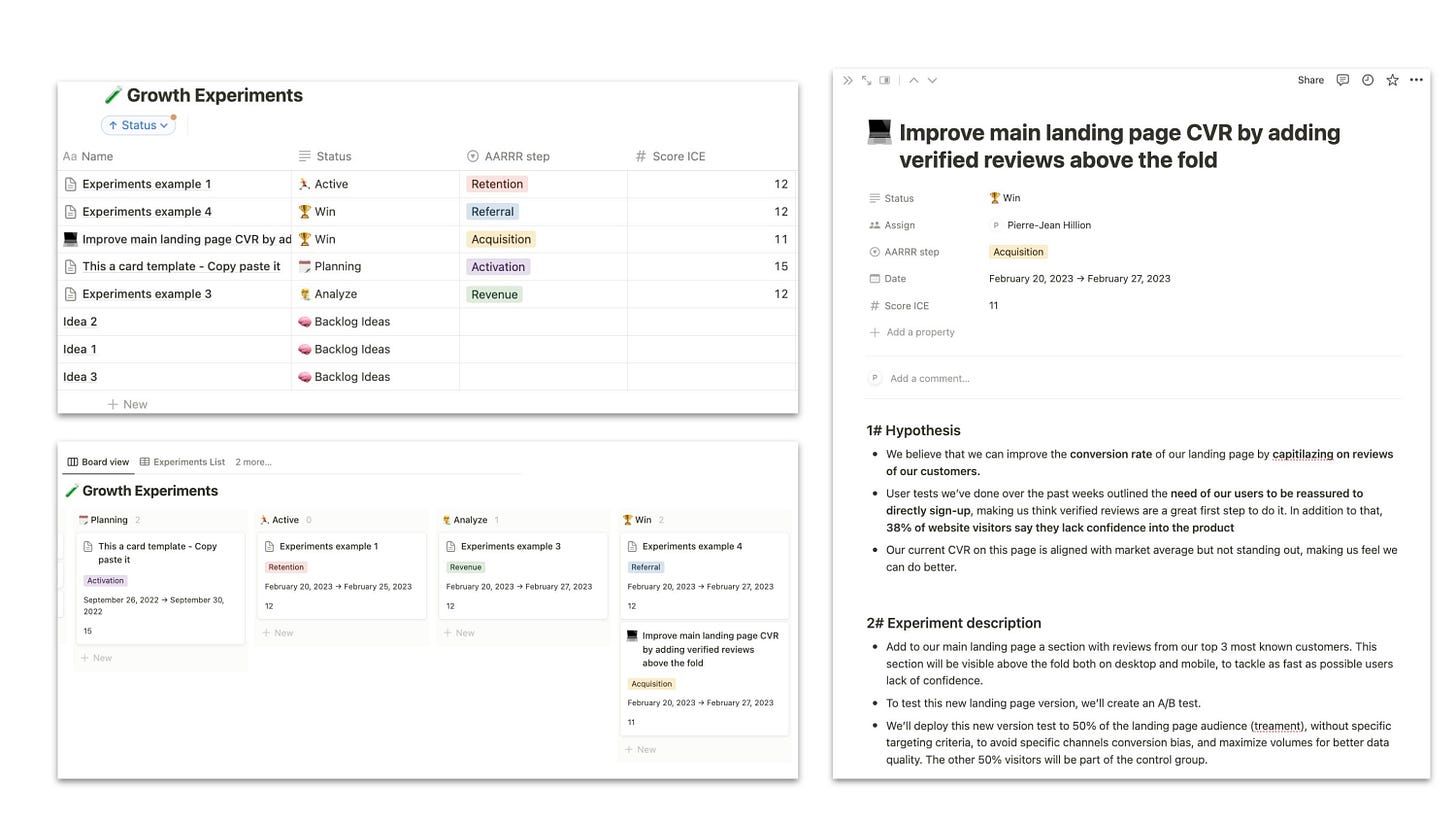
🎁 My “Growth Hacking Process” Notion template as a bonus
If you liked this article, please consider giving it a like 💙 and sharing it with a friend to help me grow The Growth Mind.
In Growth, experimenting at a high tempo is key. It’s how you:
Fail.
Get learnings on what works, and what’s not.
Succeed, by finding the winning tactics you can deploy at scale.
At BlaBlaCar, the leading carpooling platform where I work, Fail. Learn. Succeed. is one of our 6 company’s principles and probably the one that fits the most the culture of experimenting and testing new things. That’s a principle I particularly love.
But experimenting is not that easy: doing it without a clear structure and process can become messy.
That’s why I share today a framework to do it, which I use for many experiments. So let’s go through it!
📝 A simple Framework to build your Growth experiments
1# Hypothesis
→ We believe that [HYPOTHESIS]
Every experiment should start with a problem to solve (found through qualitative or quantitative data) and a hypothesis to solve it.
This step must be well defined as it’s the basis of the experiment.
So when building the hypothesis, it’s important to:
Describe why you think the experiment is worth giving a shot (problem identified).
How you’re going to solve it (solution).
How it’s going to impact growth (outcome expected).
2# Experiment description & methodology
→ To verify that, we will [EXPERIMENT DESCRIPTION]
In this section, the following elements should be included:
What you want to test → eg. an onboarding funnel step, a landing page, a price…
What is the change → a new messaging, a higher price, a new CTA wording…
How you’re going to test it → A/B test, before after…
Being as precise as possible here is essential, as it’s going to help a lot for the implementation, especially if other people like engineers are involved.
A vague description can lead to misinterpretation, and then mistakes in the implementation, making the experiment's results unexploitable.
3# Success metric
→ We’ll measure the evolution of [SUCCESS METRIC]
Defining a single metric of success is key to measuring the success or failure of an experiment.
When experimenting, trying to impact too many things at the same time is confusing and makes the analysis suggest some bias.
That’s why having a single, clearly identified metric, is the way to go.
The metric of success can either be:
Volumes (eg. number of sign-ups coming from an acquisition channel)
A conversion rate (eg. free-to-paid conversion)
An amount in € (eg. average revenue per user)
4# Success Criteria & Damage Control
→ We are right if [SUCCESS CRITERIA & DAMAGE CONTROL]
The Success Criteria is the minimum uplift you expect on your success metric to consider the experiment as a success. Having an uplift is great, but to consider an experiment as significant, having a minimal uplift threshold is better.
Otherwise, you’ll face situations where you have an uplift but you’re not very confident at scaling the experiment because the change is too small.
The damage control is a metric/part of the user experience you want to make sure you’re not degrading with your experiment.
Sometimes, experiments can win at increasing a success metric, but at the same time can degrade another one. That’s why having damage control helps to have a holistic view of an experiment's impact.
5# Estimated time
→ The experiment will run during [ESTIMATED TIME]
The estimated time includes:
the time to build the experiment;
the duration of the experiment;
and the period of analysis.
It gives a clear overview of the efforts and time needed to fully build and run the experiment.
6# Potential blockers
→ We’ve identified X and Y as [potential blockers]
Is there any blocker to run your experiment? A blocker can be technical, a lack of internal bandwidth, volumes, or budget. In summary, anything preventing you from successfully running or analyzing your experiment.
7# Tools needed
→ We’ll build the experiments with [TOOLS]
The tools you’ll need to build and run your experiments. Especially useful if you need to buy/try new tools for an experiment.
8# Estimated cost
→ The cost of the experiment is [ESTIMATED COST]
How much does your experiment cost? Generally, we only include the “direct” budget here (eg. marketing budget) and not the indirect cost (eg. salary of the team working on the experiment).
But for some experiments where a big effort is needed, it can make sense to fully assess its cost for the company.
9# ICE Score
→ During our prioritization meeting, we rated this experiment with an Ice score of [ICE SCORE].
ICE is a framework used to prioritize growth experiments. It’s an acronym standing for Impact - Confidence - Ease.
To prioritize experiments in their backlog, growth teams rate each criterion on a scale from 1 to 5. The addition of those criteria gives the ICE score.
I = Impact → What’s the expected impact of the experiment on the growth team/company north star metric? 5 = strong impact, 1 = low impact
C = Confidence → What’s the level of confidence in this experiment being a success? 5 = strong confidence, 1 = low confidence
E = Ease → How much effort do we need to put into building and running this experiment? 5 = Easy to implement, 1 = Hard to implement
10# Learnings
→ We’ve learned [LEARNINGS] by running this experiment. (To complete once the Experiment is finished)
Whether the experiment is a success or a failure, documenting and sharing learning is key to progress. That’s what will make the team and the company progress in the long run, by gathering knowledge on what’s working or not.
In the learnings sections, we want to know:
What did we learn thanks to this experiment?
Was it a success or a failure? Why?
Is there anything we’ve discovered that was not expected?
What could we do better to increase the impact of the test?
11# Next steps
→ We now have clear data to [NEXT STEP] this experiment. (To complete once the Experiment is finished)
Depending on the experiment results and learnings, there are different possible next steps:
If the experiment is a failure = Kill it or try it differently.
If there are no significant results = Kill it, continue running it to gather more learnings or change the test methodology.
If the experiment is a success = Scale it or try an improved version to see if reaching a higher impact is possible.
The next steps’ decisions are influenced by the data and learnings gathered, but also by the gut and vision of the team.
🎁 Notion template - Growth Experiments
If you want to duplicate this framework, you can steal my complete “Growth Hacking Process” Notion template, which includes:
An example of an experiment built with the article framework.
A board to track the experiment’s progress.
→ Click on “Duplicate” at the top right of the page to make it yours.
That’s all for today’s edition. See you in 2 weeks for the next one 👋
If you’d like to share feedback, feel free to reach out to me by answering this email or commenting directly on the article.


I was just recommended your newsletter, great article!
In terms of estimated time do you have an average or target, or is this completely variable in your team? I run a SaaS growth platform for experiment-led and data-driven marketers (https://growthmethod.com/) and experiments are 6 weeks by default (stolen from Basecamp and others) which we find a useful constraint.
p.s. we can import from Notion! 😉
Great one!